

Most carriers do not have a rate problem in 2026 — they have a math problem. The American Transportation Research Institute’s 2025 Operational Costs report puts the industry’s average cost to operate a truck at $2.26 per mile, while non-fuel marginal costs have climbed to a record $1.779 per mile. Translate that to a dispatcher’s daily reality: every load booked at $2.40 all-in on a 500-mile lane leaves the carrier roughly $70 of margin before deadhead, insurance, and breakdowns. That is not a thin margin. That is a losing one. The dispatchers who keep carriers profitable through Q2 are no longer just booking loads — they are running cost-per-mile math, comparing factoring against quick-pay in real time, and walking carriers through monthly profit-and-loss reviews that change behavior.
Why Cost-Per-Mile Coaching Is Now a Dispatcher’s Job
The 2024 ATRI data shows fuel dropped seven cents to $0.48 per mile, but every other line item moved the wrong way. Truck and trailer payments hit a record $0.39 per mile (up 8.3 percent), driver benefits rose 4.8 percent to $0.197 per mile, and empty miles climbed to 16.7 percent of total miles run. The carriers who survived 2025 did so by knowing those numbers down to the penny. The ones who did not are now parked. ATRI also noted that truck capacity dropped 2.2 percent as fleets sold equipment they could not keep utilized — a sign that “running cheap freight” is no longer a survivable strategy, even short-term. Dispatchers who can articulate a carrier’s true breakeven on a specific lane, before quoting, are the ones still holding rosters of paying clients into Q2 2026. The ATRI 2025 report is freely downloadable and should sit on every dispatcher’s desktop.
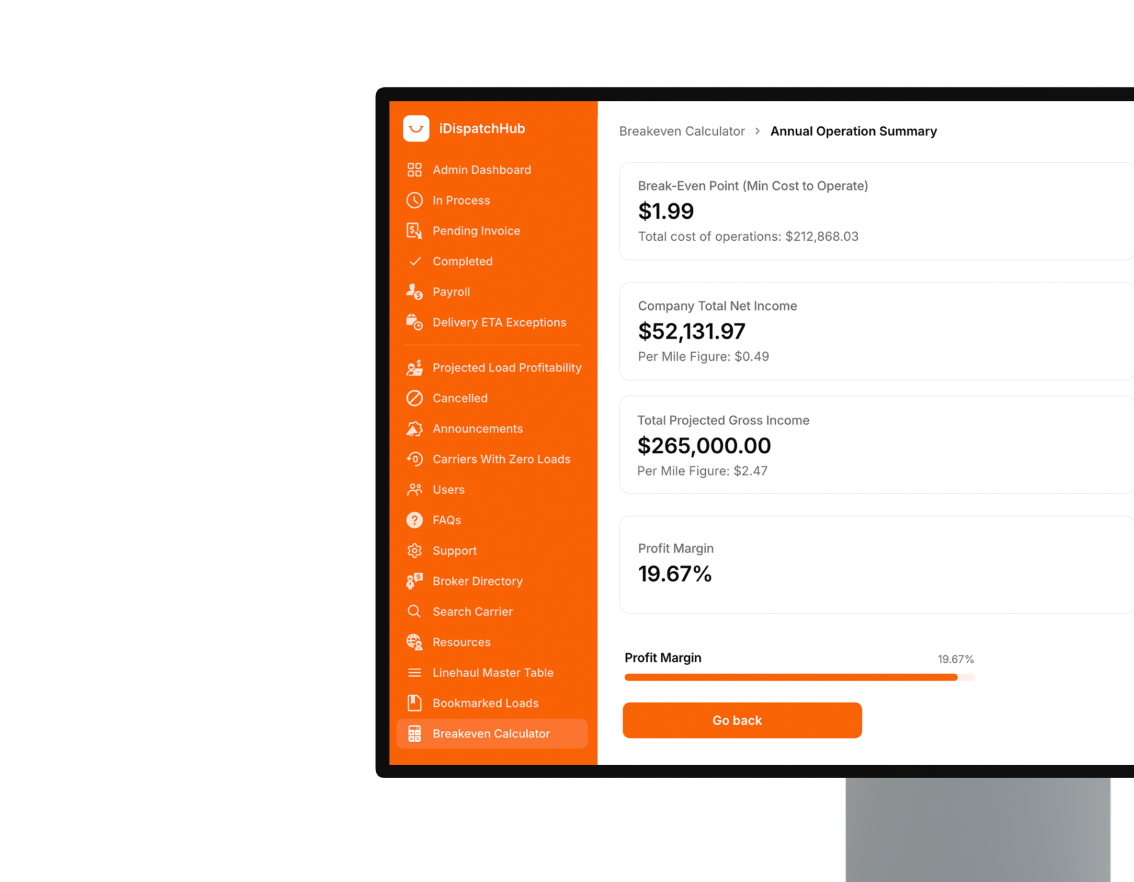
Start with a simple monthly worksheet for each carrier: fixed costs (truck note, insurance, permits, ELD, parking) divided by expected loaded miles, plus variable cost per mile (fuel, maintenance reserve, tires, tolls, driver pay). For a typical solo dry-van owner-operator running 9,500 loaded miles per month, breakeven now lands between $1.95 and $2.15 per all-in mile — and that assumes deadhead under 12 percent. Anything booked under that number is not “a cheap load.” It is the dispatcher actively transferring money out of the carrier’s pocket.
The Factoring vs. Quick-Pay Math Every Dispatcher Should Run
The “factoring vs. quick-pay” question is the single most expensive math error in the owner-operator segment. According to a 2026 benchmark from FreightFactoringUSA, factoring rates currently span 1 to 5 percent of invoice face value, with the typical small fleet paying 2 to 4 percent and new authorities running $15,000 to $25,000 a month routinely paying 3 to 4 percent. Broker quick-pay programs typically range 1 to 5 percent as well, but funding speed varies widely — many fund in 2 to 7 business days versus same-day or next-day on most factoring lines.
“A company advertising a 1.5% rate may actually cost you 4% or more once all fees are included. A company charging 3% flat with no hidden fees is often cheaper than one advertising 1.5% with seven add-ons.”
— FreightFactoringUSA, 2026 Factoring Rate Benchmark
The dispatcher’s job is to teach carriers a hybrid model: take quick-pay on brokers whose published rate is lower than the carrier’s factoring percentage, and factor the rest. On a fleet doing $80,000 a month, the difference between a flat 3.5 percent factoring contract and a disciplined hybrid is roughly $4,800 a year in pocket. Bobtail’s published comparison and Small Fleet HQ’s 2026 guide both walk through the per-load math; the dispatcher who builds that into a load-booking spreadsheet earns retention, not just commission.
Fuel, Idle, and the Monthly P&L Review
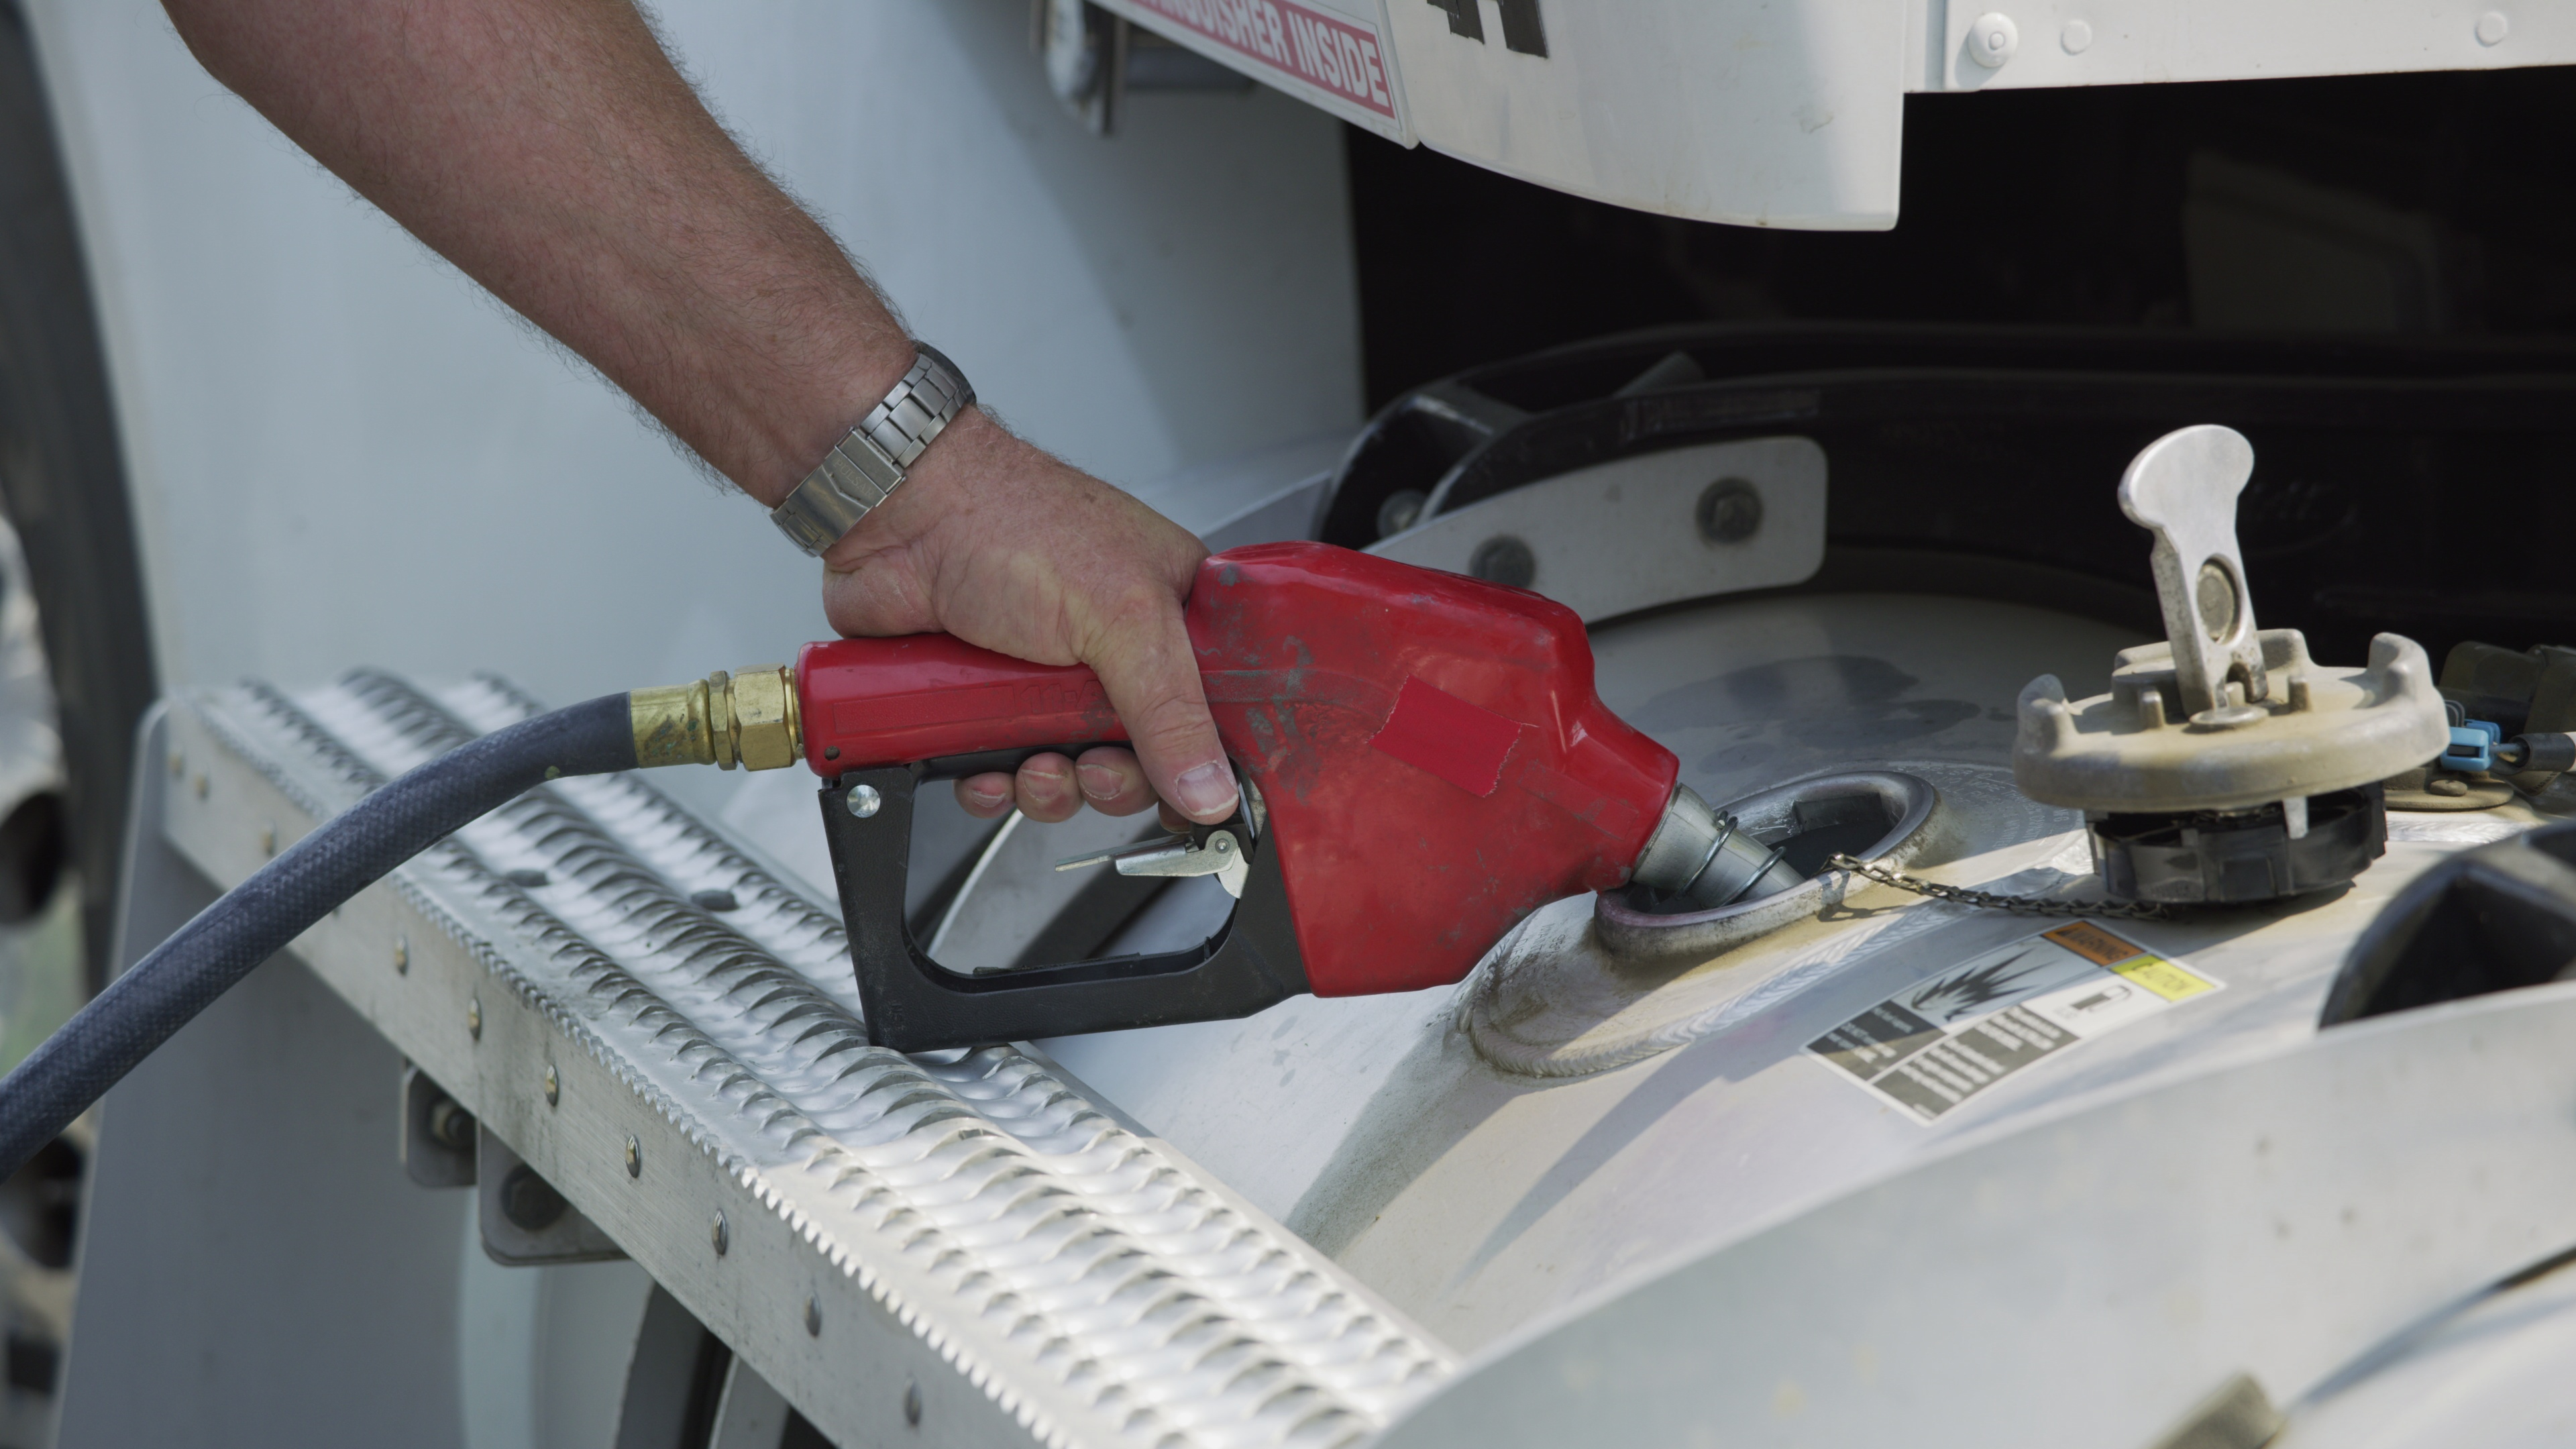
Fuel is the most coachable line on a carrier’s P&L, and the EIA’s weekly on-highway diesel update is the dispatcher’s single best benchmark for hedging conversations. Carriers running fuel cards without negotiated discounts are typically paying 25 to 40 cents above the EIA national pump average, which on a 12,000-mile month is $3,000 to $4,800 left on the table. Idle time matters just as much: every hour of idle burns 0.8 gallons and contributes nothing to revenue. A carrier idling four hours a day, 22 days a month, loses roughly $300 in fuel and another $200 in accelerated maintenance, every month.
Wrap it into a one-page monthly P&L review with the carrier — not a 10-page accounting deliverable, just the lines that change behavior:
- Revenue per truck per week — actual, not “what we billed.” Subtract chargebacks, claims, and detention disputes.
- All-in cost per mile — pulled from the breakeven worksheet, recalculated quarterly.
- Profit per truck per week — the only metric that should sit on a carrier’s fridge.
- Fuel CPM vs. EIA — if more than $0.30 above the national average, switch programs.
- Deadhead percentage — anything north of 14 percent is a dispatch issue, not a market issue.
- Factoring + quick-pay blended cost — track as a single percentage of monthly gross.
- One operational change — committed in writing for the next 30 days.

What to Do This Week
Pick your three highest-grossing carriers and run their Q1 2026 breakeven this week. Compare their factoring statements against broker quick-pay rates on the last 20 loads. If the blended cost is over 3.2 percent of gross, you have an easy retention win. The dispatchers who survive the back half of 2026 will not be the ones with the prettiest dashboards — they will be the ones whose carriers can answer two questions on demand: “what is my profit per truck per week” and “what is the one operational change I’m making this month.” Everything else is noise.